**We will be switching off the assessment section of V4 on the 31st of December 2021**
We have released a number of new features in Connecting Steps V5 this week, including printing and the reports section.
These new features almost complete the feature set within Connecting Steps V5, with only the link to Evisense remaining. The analysis section of V4 (CSAM) will remain until we release our new analytics platform next year (2022).
We will also be switching off the Connecting Steps iPad app for V4 on the 31st of December. Connecting Steps V5 works on iPads and other tablets without the need for an app.
Printing in Connecting Step V5
We have now added printing to all screens in Connecting Steps V5. You will see either a printer icon in the top right or an icon with 3 dots in the top right,with the print option underneath.
When you print, you have the option of saving as a PDF. This feature will automcatically name the file based on the screen you are printing, the pupil or group, framework, subject, profile, level and date.
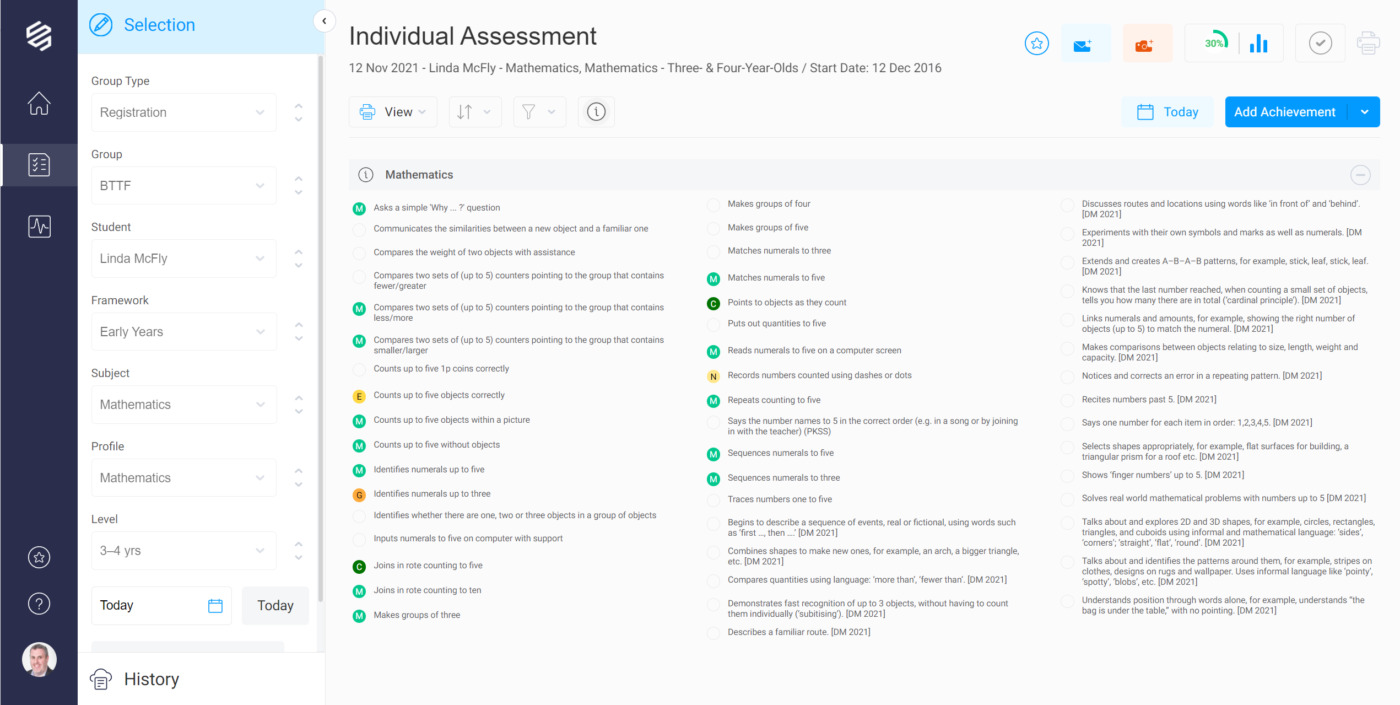
You can now print from the individual assessment screen, the print layout is designed to fit on a single page and replicates the 3 column view schools are used to when printing from V4 or from our paper files.
To create the printing of the Individual Assessment screen, we have created a new print layout for this screen. To access the print layout, click on the View button on the left, above the assessments and choose “Print View”, this will lay the content out on screen to match what you see when you print. If you do have users who print and fill in the paper files, they can use the Print View to record the data in Connecting Steps, using the same layout.
Reporting in Connecting Steps V5
We have added reporting into Connecting Steps V5. This replaces the Individual Reports and Group Reports in Connecting Steps V4. We have included all the same reports, given them more flexibility and added a number of new reports.
Assessments Achieved and Assessments to Achieve have replaced the Assessments Mastered and to be Mastered. We have also added in a new Assessments Changed. This new report will show achievements that have changed, they have been experienced for the first time, the pupil could be more engaged or require less support, they could have achieved the skill or they might have regressed. All these changes will show on the Assessments Changed report, making it ideal for pupils making low rates of progress.
The Level Progress, Line Graph and Bar Chart reports have been combined into a single report, with different view options. You can still choose between the 3 different views, but you also have some filtering and sorting options.
We have added 4 new reports to show progress in different ways:
- Non-linear Progress shows progress across multiple levels. It will show all assessments that have been achieved across the different levels a pupil is working on. This is great for pupils with spikey profiles or a pupil with a specific area of difficulty. You can choose an individual profile or produce a graph for each profile within a subject.
- Overall Progress shows progress in 3 different ways. Their balanced progress is the normal way of showing progress, bring up all areas within a profile equally. Overall progress is progress made on their current level AND any level above (non-linear progress). Real progress has been added for a specific sitation. When a pupil works across multiple levels and moves from one level to the next, it looks like they have made lots of progress and the balanced (linear) progress can show a very high value. The real progress value will show you the real progress they have made on their current level.
- Achievement Progress shows progress across all achievement/engagement levels, not just achieved (greens). This shows similar information to the pie chart, but shows it over time, with more data points. It will show the current level and the next level
- Achievements on Multiple Levels shows achievements across multiple levels, great for showing spikey profiles for pupils with more complex needs.
Flexible Reporting
Every report in our new reporting section has a range of options to allow you to customise the report:
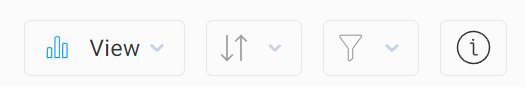
- View – The View button has a number of view options. On some reports you can change between column graph, line graph or a grid view. You can choose the layout that you prefer.
- Sort – The Sort button gives you the ability to sort the information in the report. The default option will give you the subjects in the same order as the dropdown menus. You may have the option to sort by most progress, highest level or lowest level (at the beginning or end) and other sorting options.
- Filter – The filter doesn’t appear on all reports, it will appear on group reports, where you can choose which pupils to include in the report. It will also appear on some individual reports, for example, on the Progress report you can choose which subjects and profiles to include in the report.
- Information – The information button will appear if there is information missing from the report. If a group report, it will only include pupils on that framework and if a pupil hasn’t been baselined in that area, then that pupil will not be included in the report. If they were baselined during the report, then they will only have partial data. In individual reports, the report will only include subjects and profiles a pupil has been baselined in.
- Additional Report Options – At the top of each report will additional options, based on the view you have selected. On graphs, under the Key you will find an option for monochrome or multicoloured. You can choose the view you prefer, based on your need. There is often a Zoom function on graphs, along with “Brushes” that allow you adjust the axis to suit your needs.
- Add an Additional Date to Column Graphs – On some of the column graphs (bar graphs), if you select a time frame that has a key date in between the start and end date, you can add an additional date to the graph. This can be used to show how progress has changes from 2 years ago to last year or the effectiveness of an intervention to show the increase in progress.
Want to watch our webinar on reporting?
In September we ran a webinar introducing the new reporting features. Click on the button on the right to watch the webinar and see all the new features.
Baselining in Connecting Steps is Important!
Schools have always had to baseline students in Connecting Steps. Baselining has always been an area we focussed on in training. Without baselining, your graphs and data will be wrong. Where schools hadn’t baselined or had baselined incorrectly, in V4 you would often see 800% progress or more.
Schools often didn’t realise the importance of baselining until a year after they started using Connecting Steps and tried to create graphs. The graphs were not what they were expecting. They then had to spend time baselining their students, backdating the baselines to when they started using Connecting Steps.
Some users also used a longwinded way of baselining students that often caused issues later on. We have always recommended and trained schools to baseline by marking the previous level as complete. We have never recommended schools fill in all the boxes on the previous level to complete the level.
We have made baselining much easier and more important in Connecting Steps V5. It will warn you if you haven’t baselined students in an area. If there isn’t a baseline, then they won’t appear in graphs. We transferred all baselines over from Connecting Steps V4 that were baselined in the recommend way. We cannot transfer baselines where all the boxes were filled in on the level below. Schools will need to rebaseline these students, using the date they started using the system. If your baselines haven’t transferred, please contact us and we can advise you the quickest way to baseline your students in Connecting Steps V5.
Connecting Steps V5 accesses the same data as V4. Moving to V5 will not impact your data, unless students were baselined incorrectly. All frameworks are available in V5, although some older frameworks may have limited features.
When you first log into V5, please check that your students are all baselined. The system will warn you if there is no baseline. If you see the warning, you will need to set the baseline for that student. Watch our video How to baseline students in V5 for full instructions.
Once you log into V5, the software will prompt you on which parts of the set up your school still needs to complete.
Log into Connecting Steps V5 here:
https://v5uk.connectingsteps.com
(It’s https://v5au.connectingsteps.com if you’re in Australia or New Zealand)
*Your username and password are the same for V4 and V5*
Need more help?
Visit the V5 section of our support website or reach out to our support team on support@bsquared.co.uk or 01252 870133.
Are you a school wanting to purchase Connecting Steps?
The new Connecting Steps is designed to be used for all pupils. We are also working on new assessment content designed for pupils working at Age Related Expectations (ARE), which will mean schools can use one assessment system for everyone, saving time, complexity and money.
Take a look at our online assessment software order forms. Or contact our Sales Team on sales@bsquared.co.uk or 01252 870133 to request a quotation.